Revisiting My Sony Thesis After 5 Years
The 2018 Thesis:
I first became interested in Sony in Q1 of 2018, and bought the stock by Q2 of that year. I exited the investment in Q1 2024 with a ~110% gain (~150% gain in stock price, while I averaged up along the way). Not astronomically great returns by any means, but I do have a sore spot for this investment as it was one of the first ideas I generated that actually worked. The most compelling thing that jumped out at the time was a chart from a Goldman Sachs report that I came across, reproduced here:
source: Finchat.io, company filings
It shows Sony was trading at 1.2x the market cap of Nintendo, despite producing 4.2x more operating income. Its operating income from the gaming division was the same as Nintendo’s at $1.6bn, and was on a strong run of dominating the console market with its PS4, released in 2013. With its increasingly software-like, network effects driven business model, Sony’s gaming division deserved a valuation multiple that was on par with these companies.
(For an excellent breakdown of the history and strategies of the gaming console, I highly recommend Stratechery’s Console and Competition post, which explains in great detail how the PS4 came to dominate its generation of consoles. TL;DR: Exclusive gaming content is king in today’s gaming market, while hardware differentiation is suboptimal as developers want to maximize their games’ addressable market).
Using an average EV/EBIT 2018 multiple of ATVI, EA, and Nintendo as a proxy for a fair multiples, Sony ex-gaming had the following implied EV/EBIT:
That is a really low multiple. As a brief recap, here were Sony’s business segments ex-gaming in 2018:
Music (26% of FY 2018 operating profit): Recorded music and publishing. Sony was, and still is, the second largest music record label in the world, and the industry was riding a huge tailwind in streaming, which finally figured out how to monetize music again after the existential crisis of Napster and torrenting. As a result, this segment’s revenues had doubled operating income had quadrupled from 2012 to 2017.
Pictures (6% of FY 2018 operating profit): Motion pictures, TV productions and media networks. Sony’s film studio was top 5 globally at the time. TV productions, produces, buys, and distributes TV programs. Media networks owns and operates cable channels and stations with a large presence in India, a huge growth market.
Home Entertainment & Sound (10% of FY 2018 operating profit): TVs, audio and video devices. This segment suffered in the prior ten years from new competitors such as Samsung and cheap Chinese manufacturers, but was brought back into profitability with record revenues as they benefited from an industry upswing when consumers upgraded to OLED and 4K screens.
Imaging Products & Solutions (9% of FY 2018 operating profit): Still and video cameras, lenses, medical equipment. Sony was and is an industry leader in these products, and had ~10% operating margins in 2017 for this segment, albeit its TAM was reduced substantially by smartphones.
Mobile Communications (-11% of FY 2018 operating profit): Smartphones. Sony had negligible market share (14 million units sold in 2017 vs. 1.4 billion for the entire industry). Sony began to rationalize and restructure this business starting in 2015, going from a peak unit sales of 39 million to just 2.9 million by 2020.
Imaging & Sensing Solutions (16% of FY 2018 operating profit): Semiconductors, predominantly image sensor chips used in smartphones and other devices. Sony had, and still has ~50% market share in these chips, and benefited from smartphone models adopting more and more camera lenses. Operating income went up 4x from 2012 to 2017.
Financial Services (18% of FY 2018 operating profit): Mostly domestic insurance and online banking. The least volatile Sony segment and a steady cash generator.
Did any of these deserve a 2x EBIT? With the exception of mobile, all segments had consistently improved revenues and profitability for the past 5 years. So why the low valuation for Sony?
It was due to the market fixating on Sony’s tumultuous 2006-2012 period, in which mismanagement led to Sony trying to compete with the likes of Apple, Samsung, and cheaper Chinese manufacturers in iPods, computers, TVs, and smartphones, all while their EBITDA shrank by ~50% and stock price dropped by ~85%. Beginning in mid 2012, under the direction of its new CEO, Kazuo Hirai, the company restructured, divested and cut losses in many of its consumer electronics products, managing to increase operating income by more than 3x, margins by 2.6x, and stock price by ~6x by Q1 of 2018.
source: company filings
And even without the benefits of the PS4 and gaming, Sony’s turnaround was extremely impressive:
source: company filings
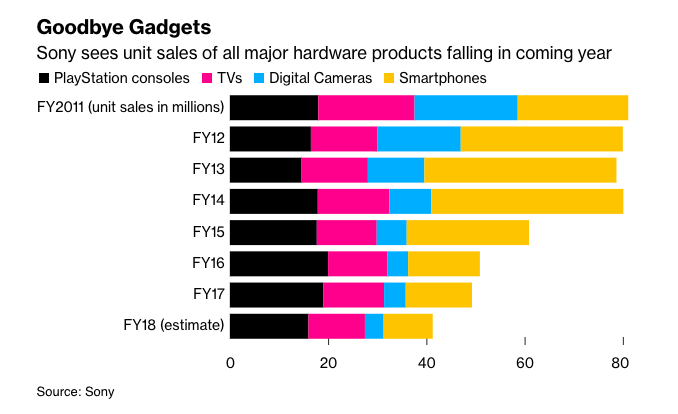
It was also clear by 2018 that management had steered the company into higher quality of earnings businesses (games, music, and image sensors), which were higher margin, more recurring, had higher differentiation and stronger moats. The narrative around Sony began to change, as pundits noticed that the company has transformed itself from a consumer electronics maker into an “entertainment and content” company. Case in point: despite selling about half as many units in electronics product than in FY 2012, Sony recorded its highest operating profit in FY 2018, and its entertainment segments (games, music, pictures) accounted for 67% of its operating profit.
source: Bloomberg
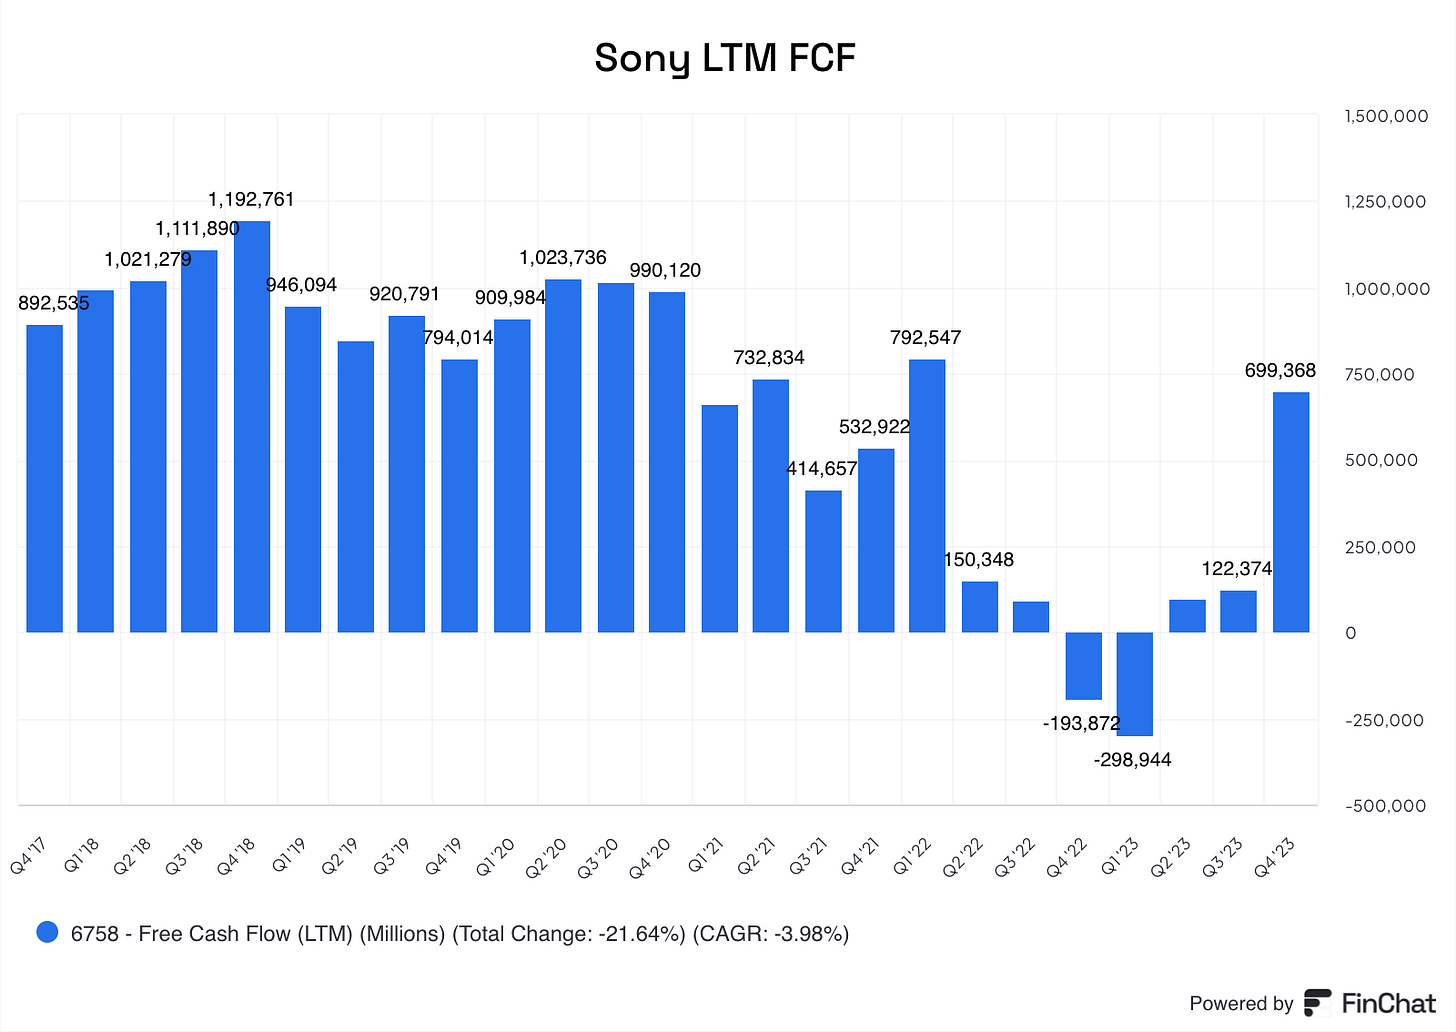
The stronger profits also translated into free cash flow growth — in FY 2018, Sony had generated ¥ 991 bn in FCF, a CAGR of ~40% since 2012. At a market cap of ¥ 6.5tn in Q1 2018, the stock was trading at a mere P/FCF of 6.6x.
To get to a ¥6.5tn market cap in a DCF model, you’d have to model for a 10-year annualized decline of FCF of 18% with a cost of capital of 9% and terminal growth rate of 2%. If you modeled for no FCF growth, the intrinsic value came out to ¥15.6tn, for a ~140% upside. So it clearly seemed there was a very wide margin of safety here. It was a relatively easy decision to buy the stock.
Why I exited the position:
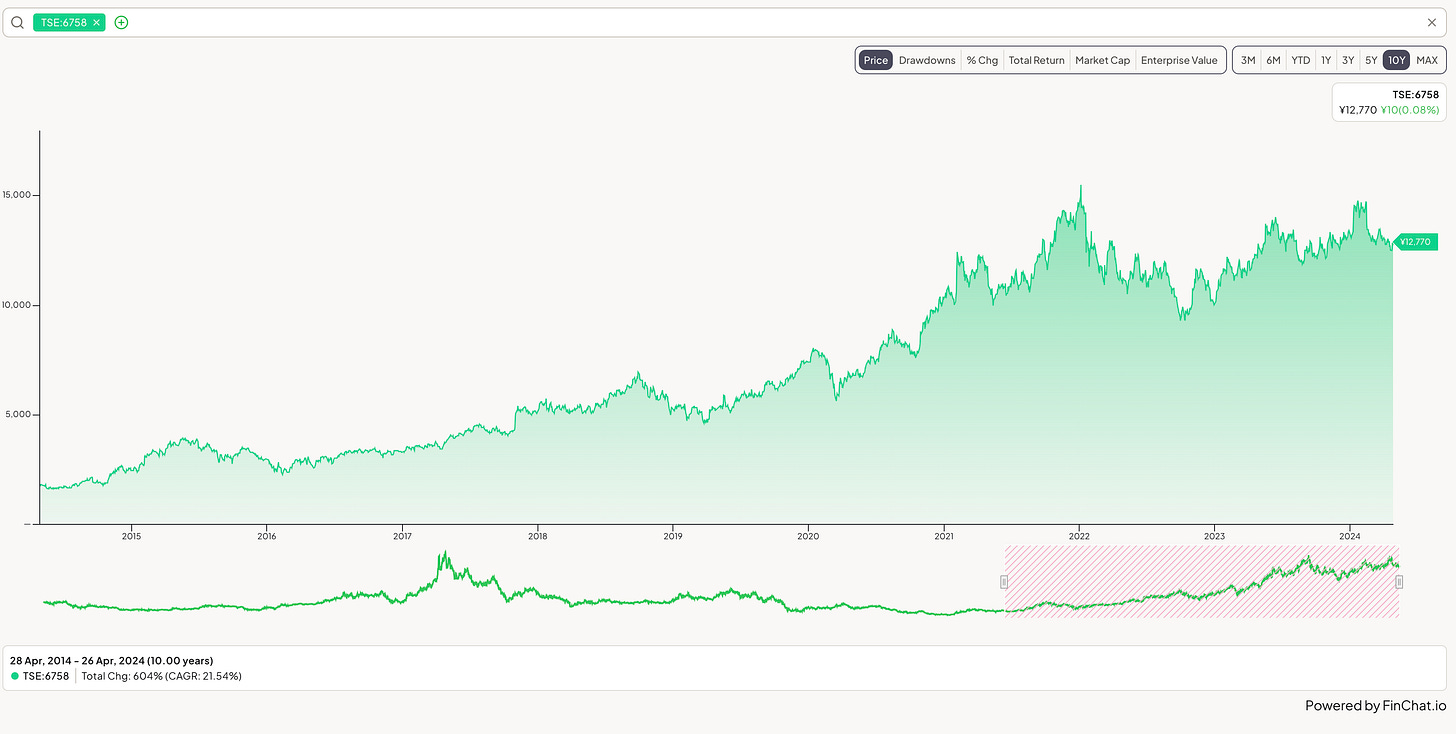
As per the chart below, Sony’s stock performed well during the mid-2018-2021 period (~150% return), then, like many other tech stocks, declined significantly (~40% for Sony) when the world began opening up from covid restrictions and inflation began to heat up. In Sony’s case, the stock recovered back to the highs it reached at the end of 2021 by January 2024, and have declined modestly since then.
I want to mention here that Dan Loeb’s Third Point invested in Sony in the first half of 2019. Third Point’s thesis were similar to mine, centering around the large discount to comparative market multiples due its “conglomerate discount”. In addition however, Third Point campaigned for the spin-off and divestiture of Sony’s image sensor chips and financials segments, respectively. Their reasons for it were that Sony should focus in its entertainment assets (gaming, pictures, and music), which were Sony’s most capital-light, high-growth, and cash-generative segments.
The activist campaign did not work, and from what I can tell, Third Point exited the position a year or so later with ~100% gains. (They also previously ran an activist campaign with Sony in 2013, when they wanted Sony to spin off its movie and music business. It did not work then also. Third Point could’ve had generated returns close to 10x if they had just passively held their position from 2013 to 2020!) In any case, their involvement brought to light Sony’s undervaluation to the broader investment community and likely caused a rally during the 2019-2020 period, and for that I am thankful.
*Check out Third Point’s 102-page 2019 pitch-deck on Sony, which dives deep into Sony’s various businesses, here.
Okay, so why did I exit the position? Let’s go back to that very simple DCF exercise. Assuming no FCF growth for 10 years, the model calculated intrinsic value as ¥15.6tn, almost exactly Sony’s market cap today (April 5th, 2024).
And what happened to FCF since 2018? It gradually declined every year, and never surpassed the highs reached in 2018, and is now more than 20% lower than the LTM FCFs of Q1 2018.
Despite this, valuation multiples actually went up, not down. P/FCF was about 7x in 2018, while today it trades at 22x. Similarly, EV/EBIT was 8x in 2018, while today it trades 19x. EBIT did grow from ¥700bn to ¥1.1tn during this period, but that earnings growth didn’t translate into FCF growth. Its notable that Sony’s multiple expansion occurred exactly as its FCF growth began to stall. Perhaps the market was giving Sony the benefit of the doubt, since its revenues and earnings were still growing and its valuation appeared irrationally low.
Modeling for a 5% FCF CAGR, the intrinsic value from a DCF today is about ¥14tn. Not even close to the margin of safety that I originally found in 2018. I’d been patient since the onset of Covid, but this valuation exercise alone was probably enough for me to finally decide to sell.
From a business perspective, these other tidbits factored into my decision:
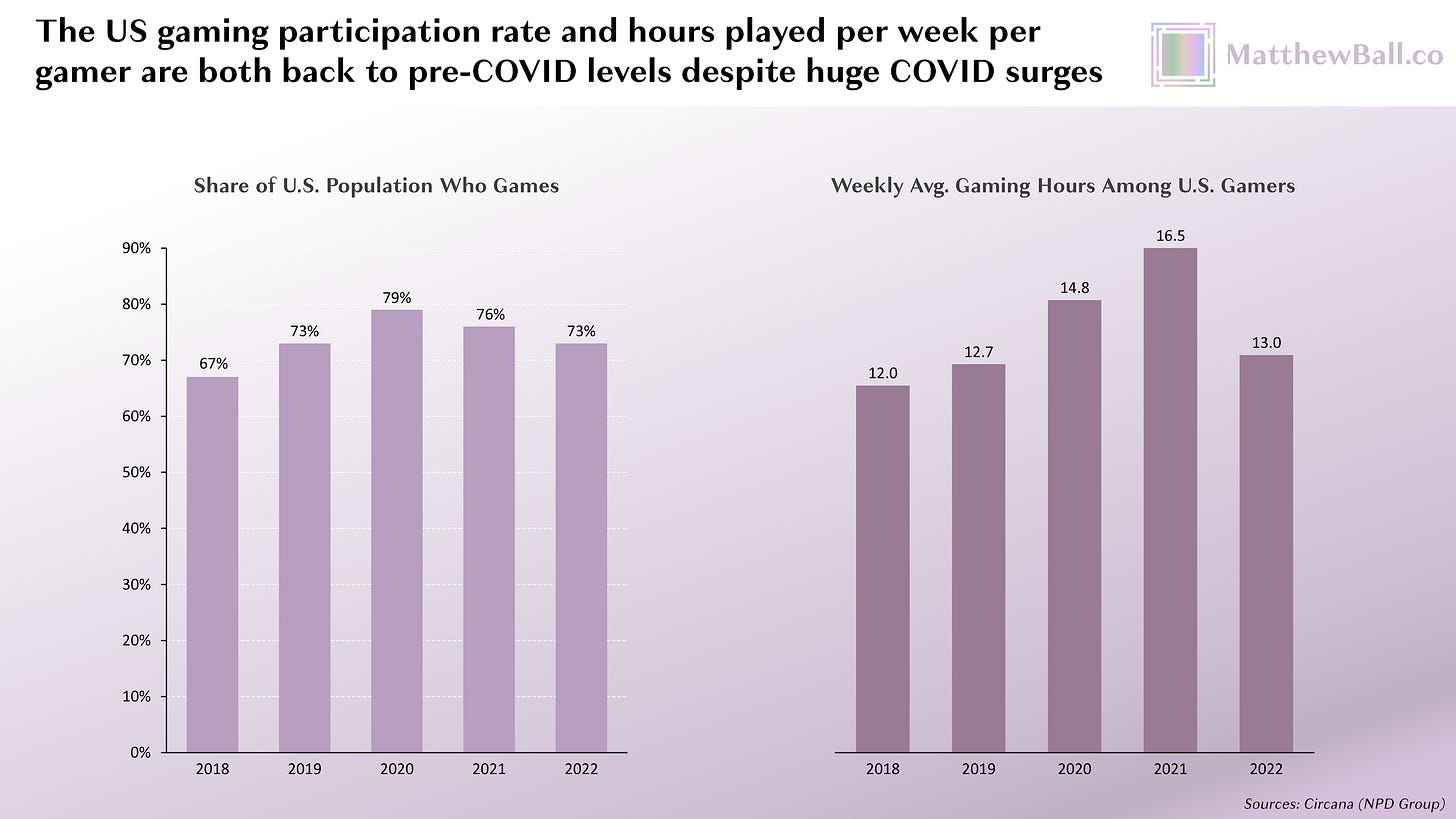
After peaking in 2021, the video games industry is reckoning with its biggest slowdown in 30 years. Game development costs have skyrocketed, yet prices of games have largely remained the same. Though still in a leading position versus its console peers, PS5 sales have peaked, and heavy discounting for growth have led to operating margins of its gaming division halving since its peak of 13.5% in 2018. A fast turnaround to the industry doesn’t look likely.
source: Matthew Ball
Sony is entering into the electric vehicles market by partnering with Honda in a JV, and plans to start selling vehicles by 2025. The move makes me nervous about management’s future growth strategies that seems to deviate from the lessons learnt in the previous decade. EVs and JVs are notoriously hard to crack, and the EV market is oversaturated. The imminent rise of autonomous vehicles also makes this kind of move hard to forecast.
Closing thoughts & things I learned:
Though I did make a decent return on this investment, the bulk of returns from Sony’s "turnaround/transformation into an entertainment company” thesis came from the 2012-2017 period, when the stock went up ~6x. If one held the stock from 2012 to now, it would be up ~12x. With the same investment experience and skills as I had in 2018, could I have had made an investment in 2012? I highly doubt it. The only reason I found it compelling in 2018 was because the financial and valuation metrics were obviously attractive. That was not so in 2012. Maybe finding a 10-bagger is never that obvious though.
By 2018, the turnaround/transformation strategy had been implemented with great success, yet the broader market hadn’t really noticed it. The lesson I learned here is that turnarounds like this can go largely unnoticed for years, even for companies with globally recognizable brands. Negative narratives can stick and persist, while positive trends are doubted. Buy when the story is not out.


